THE CENTER FOR TEACHING, LEARNING, AND ASSESSMENT @CGCC
  • Instructional Design
    • Course Planning & Design (IDR)
    • Backward Design
  • Instructional Technology
    • Canvas
    • Cisco Webex
    • Concourse Syllabus Training
    • Google@CGCC
    • Grading in Canvas
    • Migrating Instruction Into Canvas
    • Resources
    • Respondus
    • TurnItIn
  • Teaching & Learning
    • Be an Effective Teacher
    • Base Camp
    • Hybrid Summit
    • Accessibility Peak
    • Teaching & Learning Blog
    • Workshops
  • Assessment
    • Assessment Overview
    • Assessment Process
    • General Education Student Learning Outcomes
    • GEAR (General Education Assessment Resources)
    • Canvas Assessment Guides
  • About Us

How many words is an infographic worth...?

2/1/2022

0 Comments

 
Picture
Help students to more easily digest data, understand processes, get an overview of critical issues in multiple perspectives, and more. This week's post is about infographics!
Pretty sure it surprises exactly NONE of you that I am a huge fan of infographics!

Informally, I am a fan because I am fundamentally a visual person - I take notes in multiple colors, I draw to create visual explanations, and as Jen and I have often noted, both of us are likely to spend WAY more time on a single presentation slide (is it visually appealing? does it convey the information? too detailed? not detailed enough?...) than we are on less consequential things, like buying new living room furniture.
​
But formally, there is more than enough research out there regarding the Picture Superiority Effect (basically, we retain more information from images than we do from simple text) to convince me that well-crafted visuals enhance student learning.

As an example, I took the data from the "Faculty Needs" survey that we sent out last Tuesday*:
* There's still time to participate in the survey - responses will be accepted until 5pm today! 
Picture
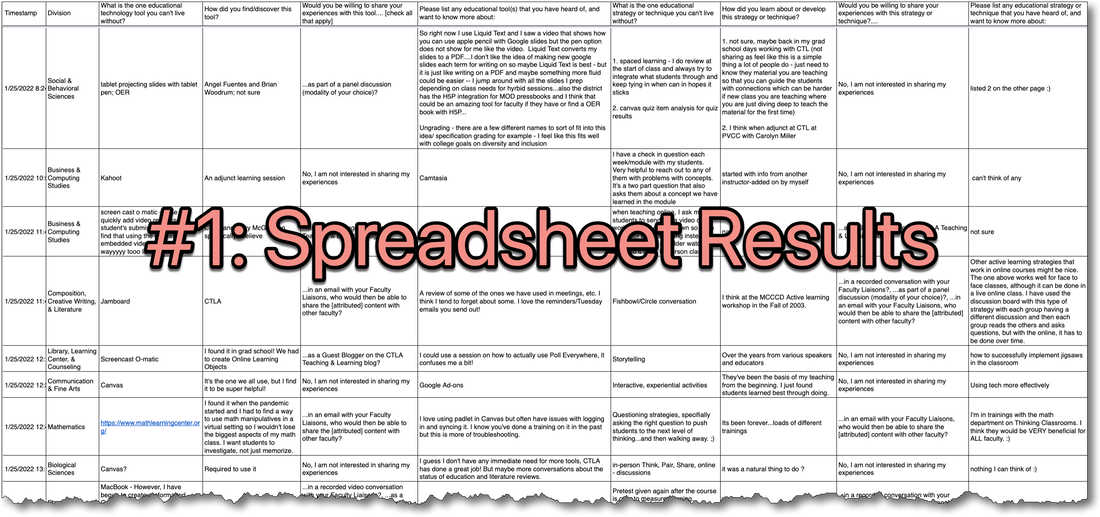
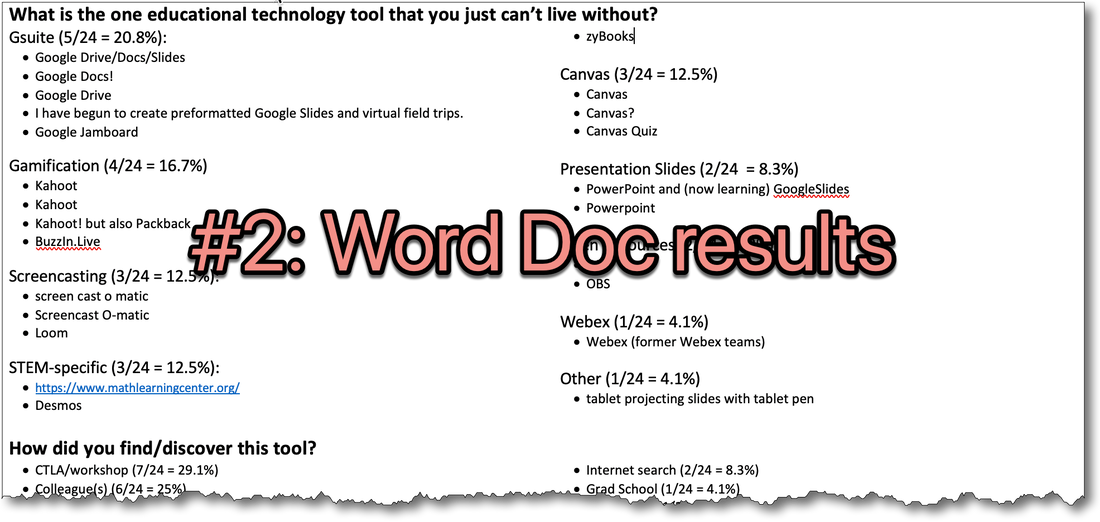
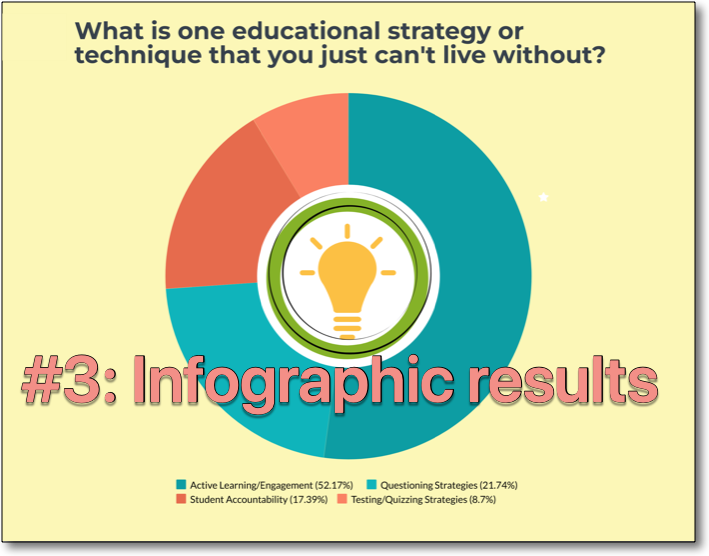
​Now for the test: if you were a student, which version of the survey results would you want to look at?
Picture
Picture
Picture

Infographics are great for instruction, but they are really great for student assignments and projects, as well!
  • Pros/Cons
  • Procedural
  • Data
  • Persuasive
  • Marketing
  • Share YOUR ideas with us!
If you are interested in trying some simple tools for creating infographics, we have resources for you from our Hybrid Summit workshops:
  • "The Pitch" page on the CTLA website contains sample infographics from CGCC faculty. The assignment was to pitch the benefits of taking these instructors' hybrid courses to prospective students.
  • The "Simple Infographic Tools" page on the CTLA website contains 3 popular tools for creating infographics, with tutorials and pros/cons for each, as well as a downloadable PDF, "Best Infographic Makers of 2020" (there was a 2021 update, but not much had changed)
As a bonus, I am providing this slightly-less-than-4-minute video, giving you a peek at the process of creating an infographic with Piktochart (I like this tool because you can include actual data for interactive charts).

​If you are interested, here is the completed version of the infographic itself, or use​ this link to go to Piktochart.
Loading...

Loading...


​DON'T FORGET - if you have other questions about Teaching, Learning, and/or Assessment, contact the CTLA! To submit a request for assistance: https://ctla.cgc.edu/help.html

HAPPY TUESDAY, EVERYONE!
Jen & Mary
0 Comments

Your comment will be posted after it is approved.


Leave a Reply.

    Picture

    Categories

    All
    Asynchronous (Fully Online) Courses
    Audio
    Canvas
    Cisco Webex
    Communicating With Students
    Faculty Development
    Free
    Google
    Graphic/Course Design
    Hybrid Teaching
    Hyflex
    Instructional Technology
    Interactive Tools
    Live Online... Live
    Multiple Attendance Options
    OER
    Policies
    Professional Development
    Teaching Tips
    Tech Tuesday
    Video

    Author

    Awesome people who want to help you do awesome stuff in the classroom! Join the conversation here or in our Facebook Group: CGCC Center for Teaching, Learning, and Assessment 

    Archives

    January 2023
    December 2022
    November 2022
    October 2022
    September 2022
    August 2022
    May 2022
    April 2022
    March 2022
    February 2022
    January 2022
    December 2021
    November 2021
    October 2021
    September 2021
    August 2021
    July 2021
    May 2021
    April 2021
    March 2021
    February 2021
    January 2021
    December 2020
    November 2020
    October 2020
    September 2020
    August 2020
    May 2020
    April 2020
    March 2020
    February 2020
    January 2020

    RSS Feed

THE CENTER FOR TEACHING, LEARNING, AND ASSESSMENT
Chandler-Gilbert Community College


TOPICS

Adjunct Faculty
Canvas
Help & How to Guides
Staff Resources
Workshops
Assessment

SUPPORT Hours

Monday - Thursday
9am - 5pm

​Friday
9am - 4pm

Contact Us

Phone: 480-726-4245
Email: CTLA@cgc.edu

Pecos Campus: MSQ150
SUBMIT A REQUEST FOR ASSISTANCE
REQUEST FOR COMBINING CANVAS COURSES

After Hours Assistance

Maricopa Canvas Support Website
Support Line: 1.888.994.4433
Submit a ticket to helpdesk@cgc.edu

Picture
© Chandler-Gilbert Community College, 2020.
  • Instructional Design
    • Course Planning & Design (IDR)
    • Backward Design
  • Instructional Technology
    • Canvas
    • Cisco Webex
    • Concourse Syllabus Training
    • Google@CGCC
    • Grading in Canvas
    • Migrating Instruction Into Canvas
    • Resources
    • Respondus
    • TurnItIn
  • Teaching & Learning
    • Be an Effective Teacher
    • Base Camp
    • Hybrid Summit
    • Accessibility Peak
    • Teaching & Learning Blog
    • Workshops
  • Assessment
    • Assessment Overview
    • Assessment Process
    • General Education Student Learning Outcomes
    • GEAR (General Education Assessment Resources)
    • Canvas Assessment Guides
  • About Us